VictoriaMetrics is a time series database (TSDB) written in Go. It's Prometheus-compatible out of the box, it speaks PromQL (with extensions via MetricsQL), accepts remote write natively, and ships as a single binary you run with CLI flags. You can deploy it as one node, and when you outgrow that, scale to a cluster without switching binaries or running a migration. It compresses datapoints down to 0.4–1.75 bytes on disk (a raw timestamp + value pair is 16 bytes), skips the write-ahead log entirely, and in production deployments consistently shows query speed improvements and infrastructure cost reductions over Prometheus, Thanos, and InfluxDB setups.
Phuong Le, an engineer at VictoriaMetrics, recently posted a thread on X about VictoriaLogs (the logging product). That thread pulled in some remarkable numbers from production users. Combined with the official case studies, you get a clear picture of who's running VictoriaMetrics and VictoriaLogs, at what scale, and why they switched.
Why Is VictoriaMetrics So Much Cheaper?
There are a few concrete technical reasons the numbers look the way they do.
Custom Compression
VictoriaMetrics uses its own compression scheme for time series data. Across the public case studies, the average datapoint size on disk is consistently between 0.4 and 1.75 bytes. ARNES (the Slovenian research network) reports 0.4 bytes per datapoint. Adsterra reports 0.75 bytes. For context, a raw 64-bit float timestamp plus a 64-bit float value is 16 bytes. Multiple people in the thread cited ~10x better compression ratios compared to InfluxDB.
No Write-Ahead Log
AbiosGaming explicitly called this out in their case study. Prometheus's WAL caused them trouble: when Prometheus hit issues and restarted, it would try to replay the WAL, run out of RAM, and enter a crash loop. VictoriaMetrics doesn't use a traditional WAL, which means faster startup times and no replay storms.
Single Binary, Horizontal Scale-Out
The deployment model is dead simple. You download one binary and run it with flags. William Gottschalk, a senior software engineer now at Netflix, confirmed this from the user side in the thread: at Outerbounds, an ML platform founded by Netflix engineers that created Metaflow, they started with a single-binary VictoriaMetrics deployment on Kubernetes, and when they needed to scale, migrating to the clustered version was straightforward.
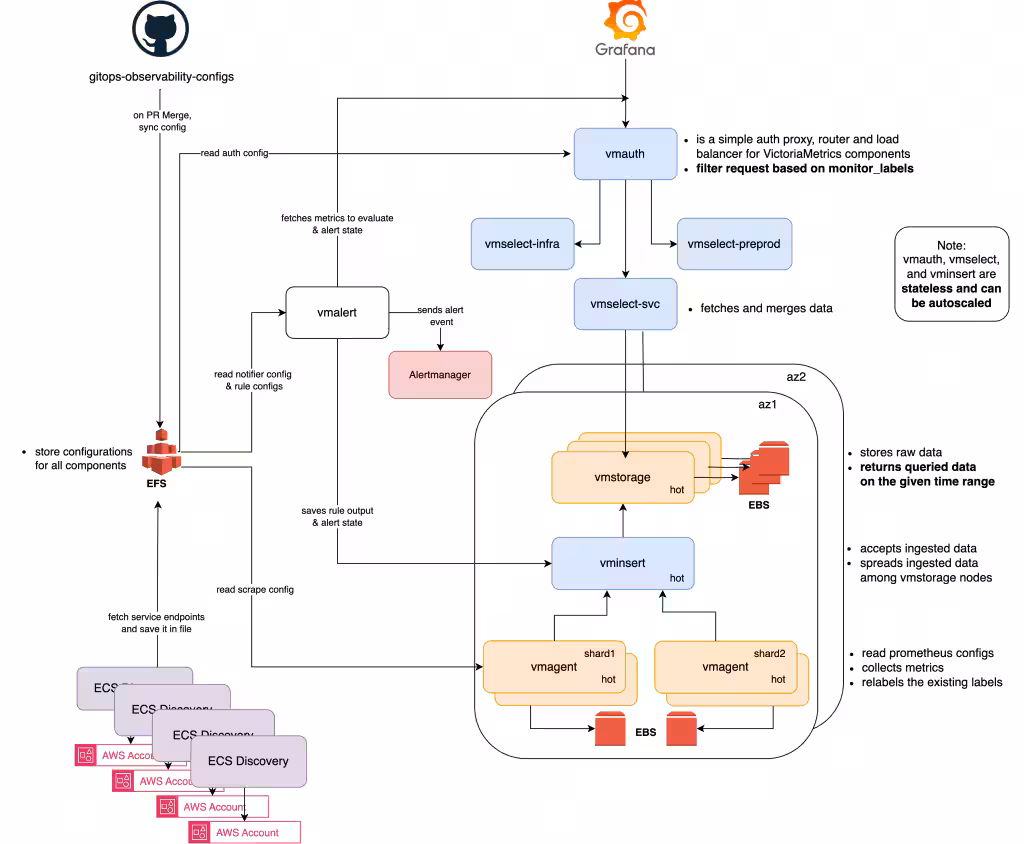
The clustered version splits into three roles — vminsert, vmselect, and vmstorage — but these are all the same binary started with different flags, not separate products or builds. You start with a single node, and when you outgrow it, you add more storage nodes. No migration step, no new binary.
Who's Running VictoriaMetrics in Production
These come from some of the most interesting case studies from the official VictoriaMetrics blog post and the numbers shared in Phuong Le's thread.
OpenAI (Codex): The Observability Stack for "Harness Engineering"
OpenAI's use of VictoriaMetrics is different from every other case study here, they're not just monitoring infrastructure, they're giving AI agents the ability to observe and reason about the software they're building.
In February 2026, OpenAI published a detailed writeup on what they call "harness engineering." A small internal team built and shipped a beta product over five months with roughly a million lines of code and zero manually-written source code. Every line (application logic, tests, CI configuration, documentation, observability setup) was written by Codex agents. Humans steered and agents executed. OpenAI estimated they built it in about a tenth of the time it would have taken to write by hand.
The observability stack is where VictoriaMetrics enters the picture, and it's the full suite: VictoriaMetrics for metrics, VictoriaLogs for logs, and VictoriaTraces for traces. What makes this setup unusual is that it's ephemeral. A temporary observability stack spins up per git worktree, gives Codex access to metrics (via PromQL), logs (via LogsQL), and traces while it works, and gets torn down once the task is complete. Codex works on a fully isolated version of the app, including its own telemetry, for every change.
This is what makes prompts like "ensure service startup completes in under 800ms" or "no span in these four critical user journeys exceeds two seconds" tractable. The agent isn't guessing, it runs the app, queries the observability stack for actual latency data, and iterates until the numbers are right. Single Codex runs regularly sustained focus on one task for over six hours, often running while the human engineers slept.

OpenAI's harness architecture: VictoriaLogs, VictoriaMetrics, and VictoriaTraces provide per-worktree observability that Codex agents query directly to validate performance and reproduce bugs
This is a significant validation not just of VictoriaMetrics, but of the full Victoria stack working together. Most of the other case studies here are about replacing one component, swapping Prometheus for VictoriaMetrics, or Elasticsearch for VictoriaLogs. OpenAI is using all three products as a unified observability layer, and doing so in a novel context: giving AI agents the same kind of telemetry access that human engineers rely on to debug and optimize systems.
Roblox: 200 Storage Nodes, 5 Billion Active Time Series
Roblox runs one of the largest known VictoriaMetrics deployments. With over 200 million monthly active users, their original observability setup was based on decentralized Prometheus and InfluxDB instances. Engineers had to jump between different tools to debug problems, and there was no single repository for metrics data. This made it harder to troubleshoot issues and limited visibility when expanding into new regions.
They migrated to a centralized VictoriaMetrics cluster with Grafana on top. The numbers from their current setup: 200 storage nodes, 5 billion active time series, and an ingestion rate of 120 million data points per second. After the migration, Roblox reported 100% availability for three straight quarters, despite moving a massive amount of data through the system.
The centralized model was the key. Instead of engineers hunting across siloed Prometheus instances, all telemetry funnels into VictoriaMetrics and is queryable through one interface.
Spotify: 10x Faster Queries, Replaced an Internal System
Spotify had built its own observability system called Heroic. It worked for a while, but eventually hit performance and scalability limits. Their requirements for a replacement were clear: low latency for ingestion, querying, and alerts; Prometheus ecosystem compatibility; cost efficiency; and an active community.
They evaluated five different solutions and ran a production-like proof of concept on each. VictoriaMetrics was the clear winner. After migrating internal teams from Heroic to VictoriaMetrics, the result was 10x faster queries and significant cost savings. Engineers on other teams who depended on dashboards noticed the difference immediately, panels that used to choke on 6-hour time ranges now loaded without issues.
Zomato: 60% Reduction in Yearly Infra Cost
Zomato connects millions of users with restaurants, handling everything from discovery to delivery. As they scaled, their Prometheus + Thanos setup started breaking down: high memory usage, slow query response times, and rising costs, particularly from high-cardinality metrics.
They migrated to VictoriaMetrics after a series of proof-of-concept tests. The migration focused on three things: reducing unnecessary metrics to minimize ingestion and storage, leveraging VictoriaMetrics' efficient query processing for faster response times, and taking advantage of the optimized storage format. Post-migration, they scaled to billions of data points daily with a 60% reduction in yearly infra cost.
Ayush Chauhan from Zomato shared their detailed migration blog post in the thread, it's one of the better public writeups on the full journey from Thanos to VM.
Wix.com: 50 Million Active Time Series Per Instance
Wix needed to redesign their metrics infrastructure from scratch after moving to Kubernetes. They tested Prometheus federated, Cortex, IronDB, and Thanos. Their priorities, in order: at least 3 months of raw-data retention, no aggregation or sampling, high query speed, clean failure states for high availability, and enough headroom to grow to 100 million active time series.
They ended up with an HA pair of single-node VictoriaMetrics instances behind Prometheus with 2-hour local retention and remote write. Each VictoriaMetrics instance handles 50 million active time series, 1.1 million data points per second ingestion, and stores 8.5 trillion total datapoints. Their median query latency is ~1ms, with a 99th percentile of ~1 second. The churn rate is 150 million new time series per day.
A detail worth noting from Wix's experience: they specifically valued the "clean fail state", their concern with multi-node clusters was that partial data could cause false alerts. Single-node VictoriaMetrics is either up and correct, or it's down. That simplicity mattered to them.
Xiaohongshu: 50,000 CPU Cores Across 30+ Clusters
Xiaohongshu (Little Red Book), one of the largest lifestyle platforms in China, runs more than 30 VictoriaMetrics storage clusters in production. These cover all their key business areas: recommendations, search, community, advertising, and infrastructure.
The scale is staggering: close to 50,000 CPU cores dedicated to VictoriaMetrics clusters, 2,400 TB of data on disk, and a total scrape volume of 2.4 billion samples per scrape interval (15 seconds). Their largest single cluster ingests 450 million samples per scrape. Query rates across the fleet hit around 2,300 range queries per second and 260 instant queries per second.
What stands out here is the migration result: after replacing Prometheus with VictoriaMetrics, they saved over 10,000 CPU cores across their fleet.
VictoriaLogs: The Logging Side
A lot of the recent visibility for VictoriaMetrics actually comes from VictoriaLogs, their newer logging product. It's a separate system with its own architecture, so it's worth covering on its own terms.
Design and Query Model
VictoriaLogs is schemaless. You don't pre-define a schema or create index mappings, all fields are automatically indexed and searchable. It supports ingestion from multiple formats and sources out of the box: Elasticsearch Bulk API, Loki, OpenTelemetry, Datadog, JSON Lines, Journald, and Syslog.
The query language is LogsQL, which works like a pipeline: you write a filter to select logs, then chain pipes with | to transform and aggregate results. The stats capabilities are Prometheus-compatible enough that vmalert can query VictoriaLogs directly for alerting rules.
Cluster Architecture and Scale-Out
The cluster architecture follows the same philosophy as VictoriaMetrics but with its own set of roles: vlinsert, vlselect, and vlstorage. These are all the same binary started with different flags, not separate products or builds. This was a point of debate in the thread, one commenter argued that VictoriaLogs cluster mode is "more complicated than Elasticsearch" because it has three separate component roles. Valialkin (CTO of VictoriaMetrics) replied that the separation is explicit by design, not accidental complexity. Phuong Le's architecture blog post makes this even clearer with diagrams: you start with a single node, and when you outgrow it, you add more storage nodes and point your gateway instances at them.
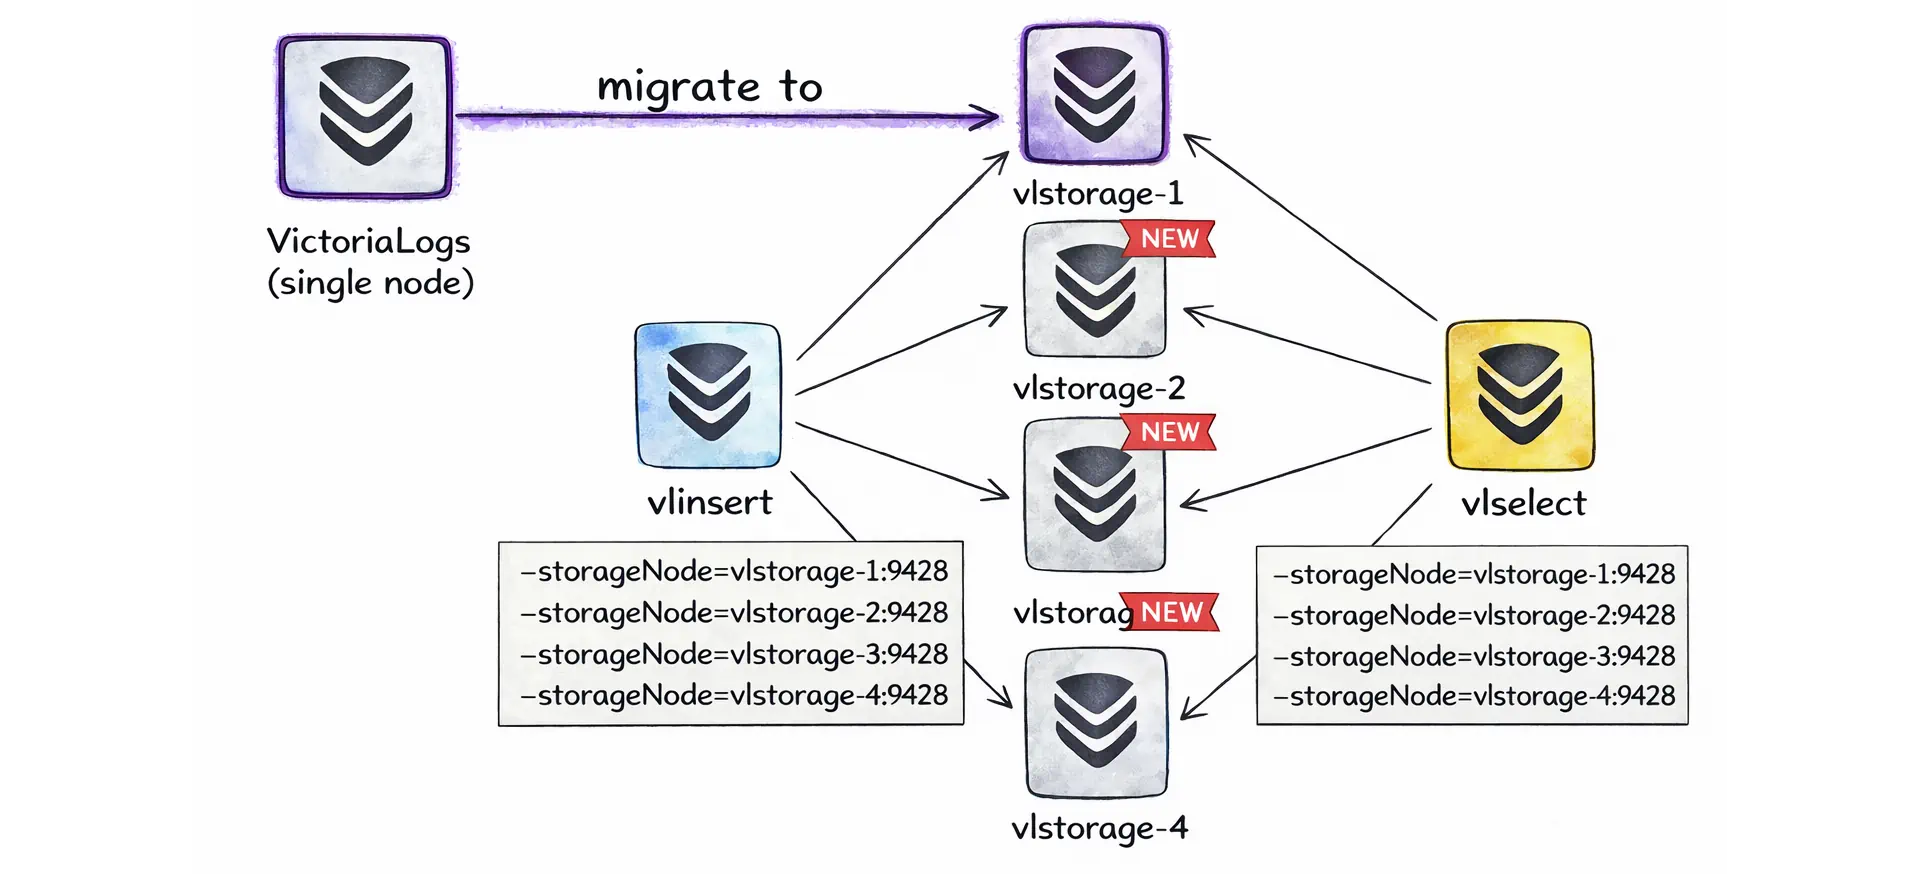
VictoriaLogs cluster components vlinsert, vlselect, and vlstorage topology.
High availability is done at the ingestion layer, you send the same logs to multiple independent instances, rather than through storage-node replication.
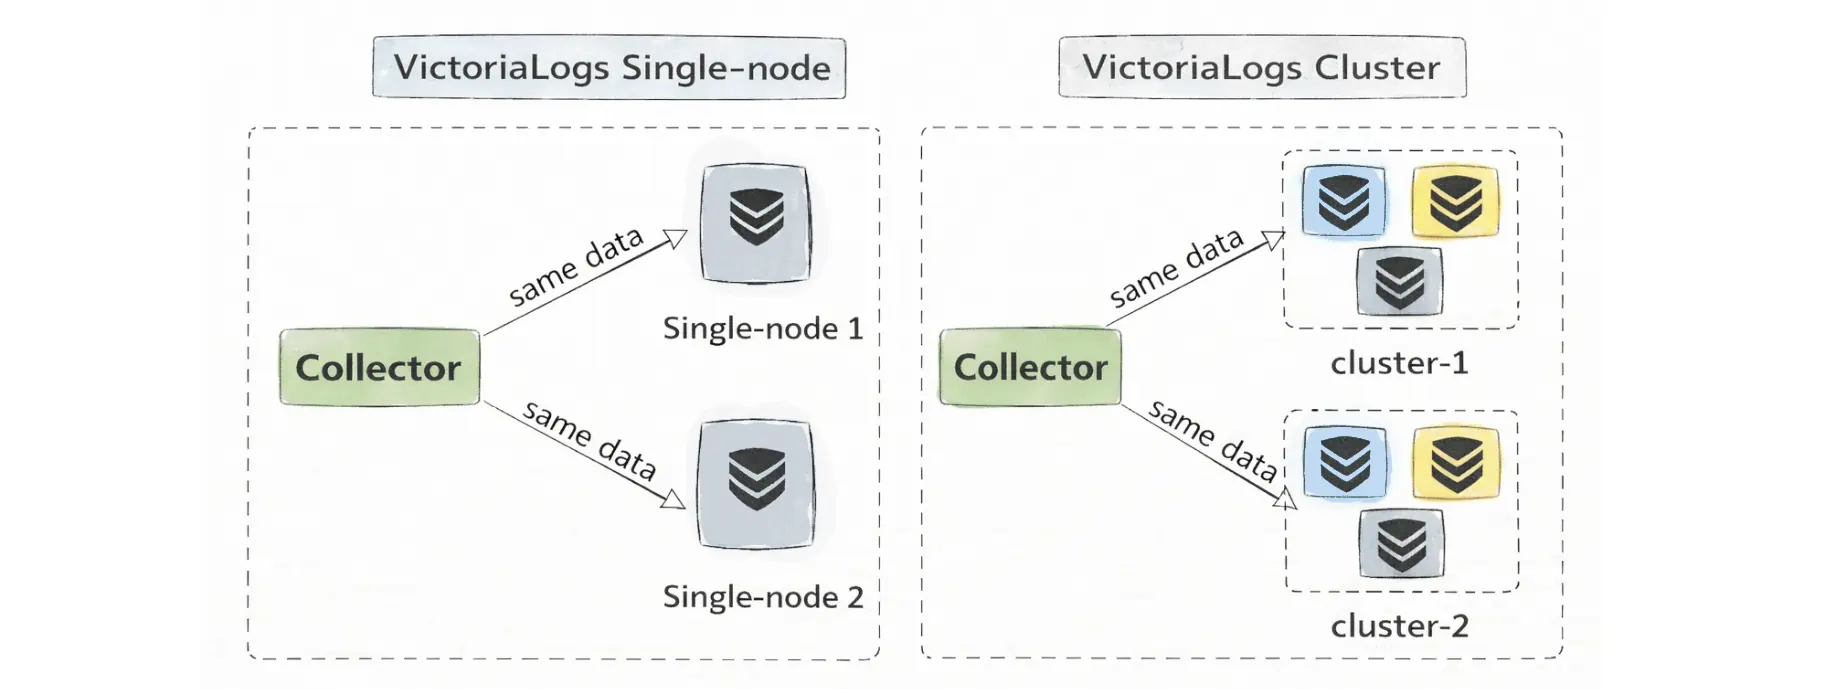
High availability via ingestion replication, with the same logs sent to multiple VictoriaLogs targets.
Binary Size
VictoriaLogs ships as a 20.7 MiB binary. Compare that to Loki at 123.8 MiB, ClickHouse at 727.1 MiB, and Elasticsearch (bundled) at 1.3 GiB. This matters in practice for edge deployments and resource-constrained environments, and it's a signal about how much dependency weight the system carries.
The Mastodon Post: 27 Elasticsearch Nodes Down to 1
In the thread, Phuong Le shared a Mastodon post that might be the most striking data point of all. A user replaced a 27-node Elasticsearch cluster — 588 CPU cores, 4,656 GB of RAM — with a single VictoriaLogs node running 8 CPU cores and 64 GB of RAM. They shipped 100 million logs in an hour, and the box was "basically idling with only a couple of GB of RAM used." Random search queries returned in a fraction of a second.
Some people in the thread were skeptical. One reply: "4 TB of RAM down to 64 GB? Handling the same volume of logs? I don't know, Rick...", it's a fair reaction. But the VictoriaLogs architecture explains how this kind of reduction is possible: schemaless indexing, no JVM overhead, and tight compression.
VictoriaTraces: The Tracing Side
One important distinction that came up in the thread: VictoriaLogs is a log database, not a tracing backend. When someone asked about OpenTelemetry tracing support, Phuong Le clarified that VictoriaLogs supports OTEL log ingestion, but traces are handled by a separate product: VictoriaTraces. That product is earlier-stage, the VictoriaTraces team mentioned they were planning a dedicated UI and had been iterating since the initial release.
The Trade-Offs
No system is without trade-offs. Some apply to VictoriaMetrics, some to VictoriaLogs, and some to both.
SSO and Enterprise Features (Both)
One commenter raised this in the thread: SSO/LDAP is enterprise-only. This is a real concern for organizations with strict access control requirements. Valialkin responded that they're working on providing SSO in the open-source vmauth component, but as of now, if you need LDAP integration, you need the enterprise version.
No Object Storage Backend for Logs (VictoriaLogs)
Someone in the thread asked whether VictoriaLogs can store logs on S3 like Loki does. The answer is no, VictoriaLogs stores on local disk. This is a deliberate design trade-off. Local disk is faster and simpler to operate, but you don't get the "infinite retention on cheap object storage" model that Loki offers. If your primary requirement is very long retention with infrequent queries, this matters.
Cluster Complexity Is Different, Not Zero (VictoriaLogs)
A back-and-forth in the thread with Valialkin about clustering is instructive. Elasticsearch runs as a single process per node that handles everything internally. VictoriaLogs separates insert, query, and storage into explicit roles that you wire together (typically through a load balancer like vmauth). The VictoriaMetrics team argues this is simpler because there's "zero magic", everything is explicit. But for an operator who's used to Elasticsearch's model, it's a different kind of complexity, not the absence of complexity.
Large-Scale Uncertainty (VictoriaMetrics)
It's fair to be skeptical about whether any TSDB is truly scalable at hyperscaler scale. Roblox at 5 billion time series and 200 storage nodes is the strongest public counter-evidence. OpenAI is running the full Victoria stack for their Codex agent workflows, as covered above. But compared to Prometheus or Elasticsearch, there are fewer public post-mortems from FAANG-scale deployments. The case study list includes CERN, Spotify, Naver, and Roblox, which is serious credibility, but if you're at true hyperscaler scale, you may still be in relatively uncharted territory with VictoriaMetrics.
What's Actually Happening Here
Eight years of heads-down work on a Prometheus-compatible TSDB is now paying off. The product wasn't marketed heavily; it spread through benchmarks, word of mouth, and migration case studies from teams that were running into walls with Prometheus, Thanos, Cortex, and InfluxDB. VictoriaLogs is extending the same philosophy into the logging space: compression-first, simple deployment, explicit architecture. The early production numbers are hard to ignore.
The open question isn't whether VictoriaMetrics works, it clearly does, and at significant scale. The question is whether the broader ecosystem (tracing with VictoriaTraces, SSO in open source, object storage support, dashboarding UX) matures fast enough for VictoriaMetrics to become a complete observability platform rather than "the thing you replace your TSDB with."
For now, if you're running Prometheus and hitting walls on retention, memory, or cost, VictoriaMetrics is probably the first thing worth evaluating. And if you're drowning in Elasticsearch costs for logs, VictoriaLogs deserves a serious look too.